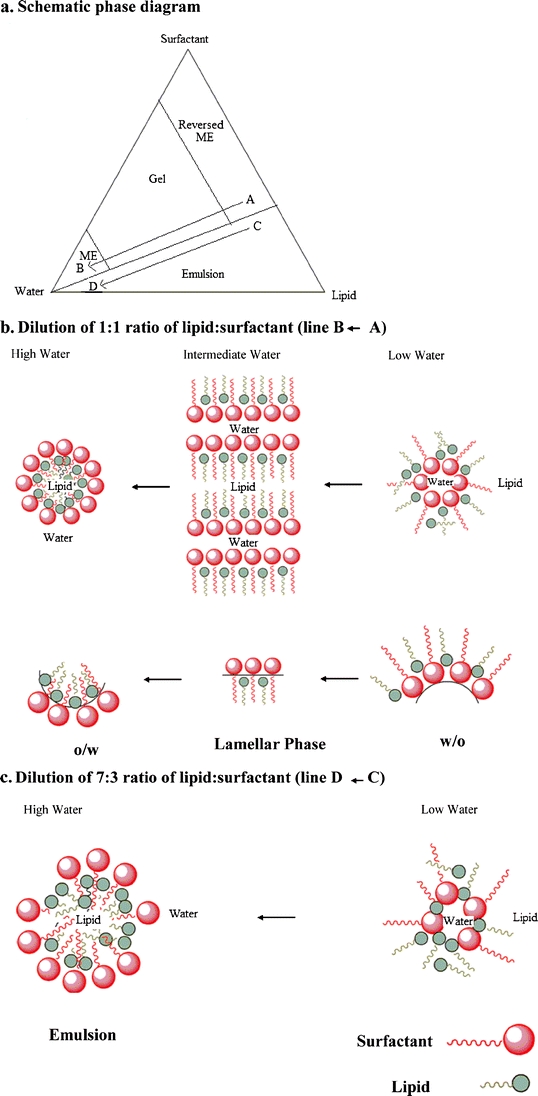
Fig. 9.

Schematic representation of (a) phase diagram with dilution curve, (b) conversion from w/o into o/w microemulsion passing through the gel phase as shown by line A to B in the phase diagram, and (c) conversion from w/o into o/w emulsion as shown by line C to D in the phase diagram.
