
Fig. 5.
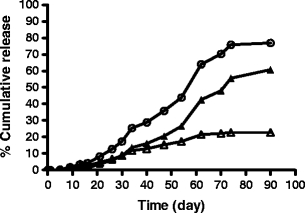
In vitro release of octreotide from PLGA (the results are from one study); (∆) native octreotide, (▲) acylated octreotide and (○) total octreotide (native and acylated octreotide adducts). The percentage of release is based on the LC of PLGA microspheres detected by HPLC (Table II).