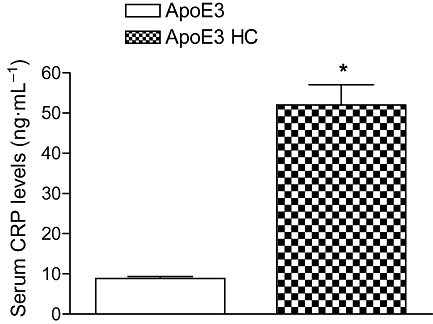
Figure 7.

Analysis of the CRP in HC-fed ApoE3 mice using an immunoturbidometric method. The columns represent the change in the HC-fed ApoE3 groups compared with their age matched ApoE3 control. Values are mean ± SEM (n = 6 mice per group). *P < 0.05, as compared with ApoE3 mice.
