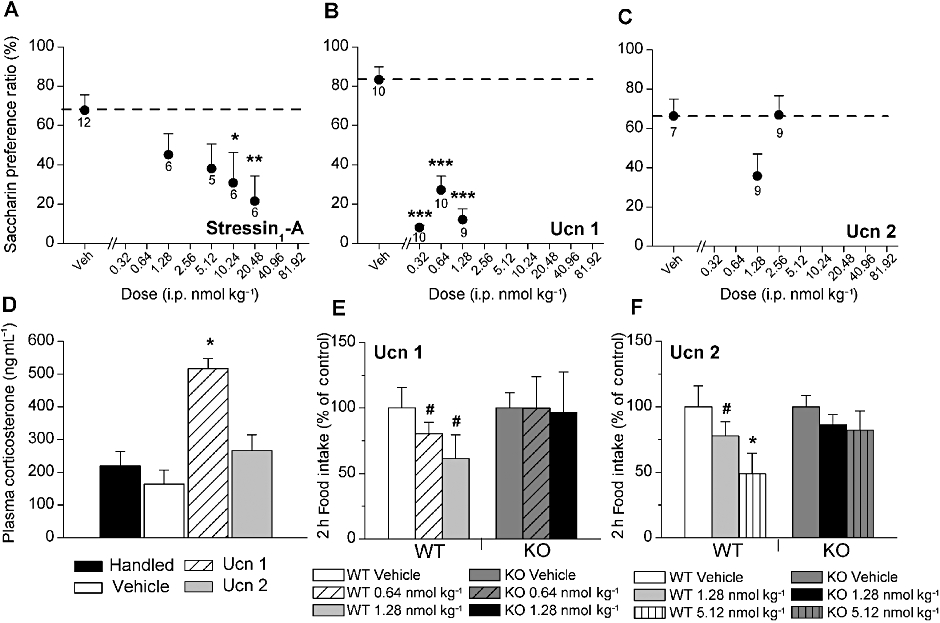
Figure 7.

Effects of i.p. administration of (A) stressin1-A (B) Ucn 1 and (C) Ucn 2 on the formation of a CTA. A relative decrease in the saccharin preference ratio is interpreted as the formation of a CTA. Data are expressed as the mean (±SEM) preference ratio for a 7.31 mM saccharin solution over water as a function of having received two prior pairings of i.p. stressin1-A, Ucn 1 or Ucn 2 injections immediately after access to a previously novel saccharin solution. *P < 0.05, **P < 0.01, preference ratios significantly lower after stressin1-A (10.24 and 20.48 nmol, respectively). ***P < 0.001, Ucn 1 (0.32, 0.64 and 1.28 nmol, respectively) compared with respective vehicle treatment (between-subjects LSD test). Sample size is indicated beneath each symbol. (D) Effect of handling (no injection; n = 7), vehicle (n = 7), 0.64 nmol Ucn 1 (n = 7) and 1.28 nmol Ucn 2 (n = 6) on plasma corticosterone level. *P < 0.05, corticosterone level significantly higher after Ucn 1, but not Ucn 2, treatment compared with vehicle treatment (between-subjects LSD test). (E–F) Effects of Ucn 1 (E) or mouse Ucn 2 (F) on the mean (±SEM) 2 h food intake in wild-type (WT, Ucn1, n = 8, Ucn 2, n = 5) and CRF2 receptor knockout (KO, Ucn 1, n = 5, Ucn 2, n = 6) mice. Statistics were performed on the raw data but are presented as % of vehicle intake (g·kg−0.75 bw) changes to facilitate comparison. Two-hour intake for vehicle-treated subjects were 51.8 or 24.6 g·kg−0.75 bw for Ucn 1 or Ucn 2 studies, respectively. *P < 0.05, # P = 0.06, Ucn 1 and Ucn 2 significantly decreased food intake in WT mice but not in CRF2 KO mice.
