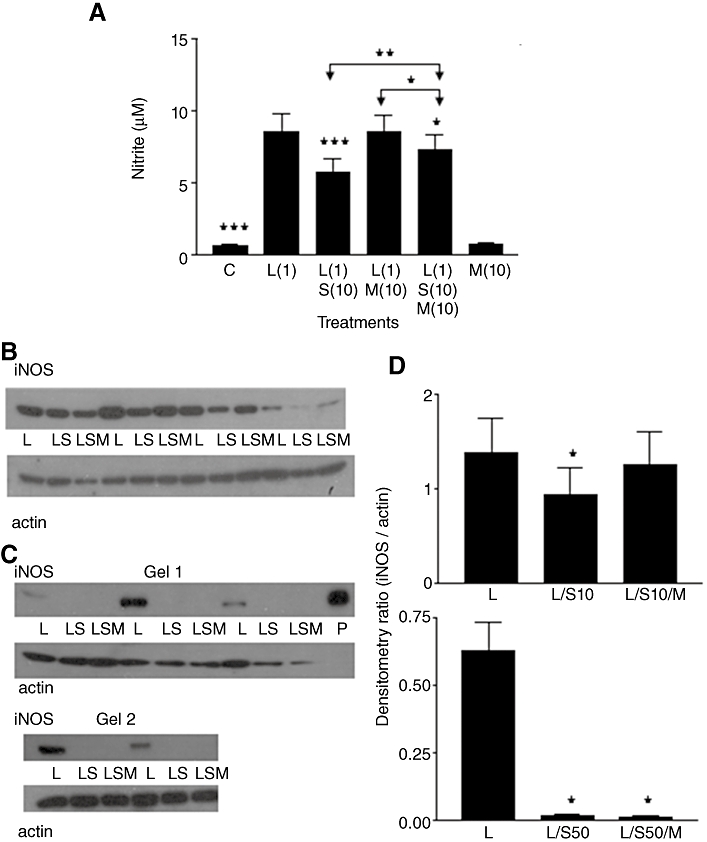
Figure 4.

(A) Nitrite production in rat aortic smooth muscle cells. Results are means ± SEM of individual cultures from 14 rats. Treatment groups: control (C), LPS (L), spironolactone (S), mifepristone (M). Numbers beside drug abbreviations are concentrations in µg·mL−1 (LPS) and µM (spironolactone or mifepristone). (B) Immunoblotting of four individual cultures run on one gel. From left to right, groups of three adjacent lanes show corresponding treatments for each culture (L = 1 µg·mL−1 LPS; LS = mixture of L with 10 µM spironolactone; LSM = mixture of LS with 10 µM mifepristone. (C) Immunoblotting of five cultures run over two gels. Same abbreviations as used in (B) but treatments included 50 µM spironolactone. ‘P’ represents sample of mouse macrophage protein extract containing iNOS. (D) Treatment group means (±SEM) of iNOS/actin band intensity ratios from densitometry. Abbreviations the same as in (B/C), but S10 and S50 denote 10 µM spironolactone and 50 µM spironolactone respectively. *P < 0.05, **P < 0.01, ***P < 0.001, comparing LPS alone with controls or with LPS/steroid mixtures, except where other group comparisons are indicated by bridging arrows.
