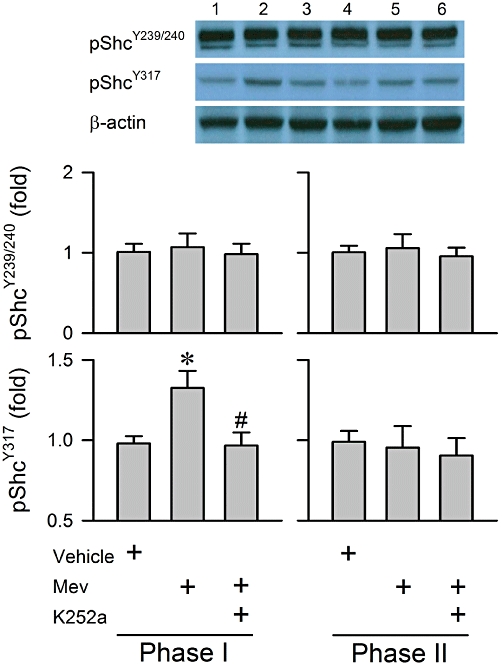
Figure 3.

Illustrative gels and a summary of fold changes in protein expression of phosphorylated Shc at the Tyr239/240 (pShcY239/240) and Tyr317 sites (pShcY317) determined by Western blot analysis from the ventrolateral medulla obtained during phases I or II after rats had received a microinjection, bilaterally into the RVLM, of Mev (10 nmol), given alone or in addition to pretreatment with K252a (1 pmol). Values are mean ± SEM of triplicate analyses on samples from four to six animals in each group. *P < 0.05 versus vehicle group and #P < 0.05 versus Mev group in the Scheffé's multiple-range analysis. Note numbers on top of the gels correspond to columns in the data summary.
