
Figure 5.
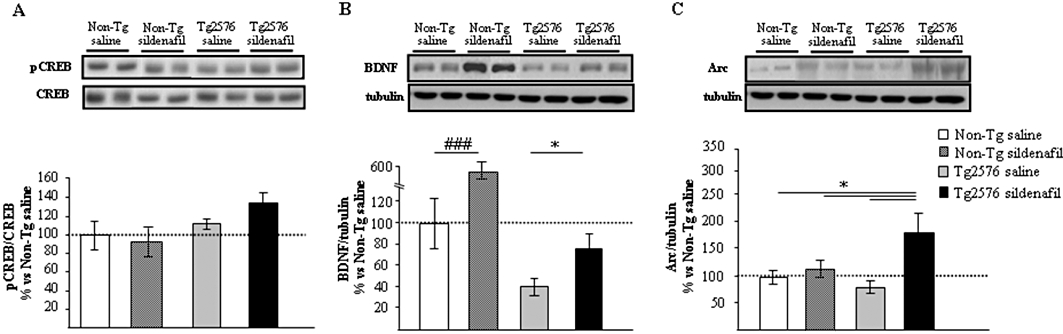
Regulation of gene expression with sildenafil in mouse hippocampus. Western blot analysis of pCREB (A), mature BDNF (B) and Arc (C) in the hippocampus of aged non-transgenic (Non-Tg) and transgenic (Tg2576) mice treated with saline or sildenafil. Representative Western blot bands from hippocampal tissues of non-transgenic mice (Non-Tg), and transgenic mice (Tg2576) receiving saline (Non-Tg saline; Tg2576 saline) or sildenafil (Non-Tg sildenafil; Tg2576 sildenafil) are shown. The histograms represent the quantification of the immunoreactive bands in the Western blot. Data are expressed as mean percentage (±SEM) of the results from versus Non-Tg mice receiving saline (Non-Tg saline, 100%). n = 5–6 in each group. *P < 0.05, significantly different from Tg2576 sildenafil mice; ###P < 0.001, significantly different from Non-Tg saline mice (Kruskal–Wallis followed by Mann–Whitney post hoc test).