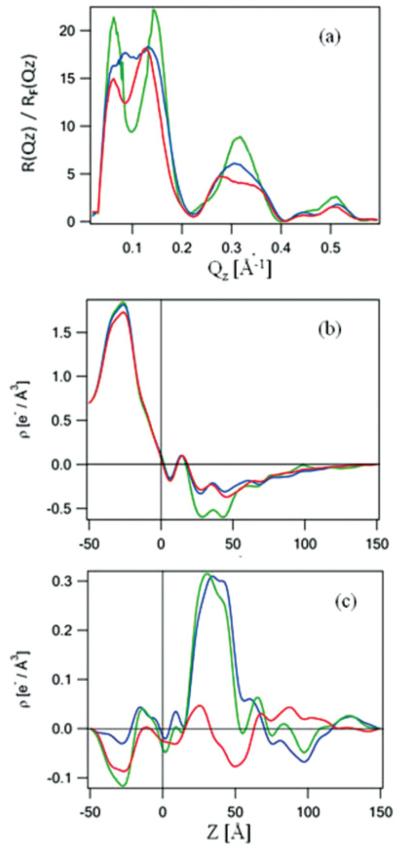
FIG. 5.
(Color online) The interferometric x-ray reflectivity results from a specimen prepared via the directed-assembly approach. The Fresnel-normalized reflectivity data are shown in (a) and the corresponding absolute electron density profiles in (b), where green (light gray) corresponds to the Si-Ni-Si multilayer substrate itself, blue (dark gray) to the tethered VSD-POPC monolayer, and red (gray) to the putative reconstituted VSD-POPC bilayer membrane. The difference electron density profiles, referenced to the profile of the Si-Ni-Si substrate itself, are shown in panel (c), where the blue (dark gray) profile is that of the VSD-POPC monolayer, the green (light gray) profile that of the reconstituted VSD-POPC membrane, and the red (gray) profile is the difference between them, namely the VSD-POPC membrane profile minus that for the VSD-POPC monolayer.

