
Figure 9.
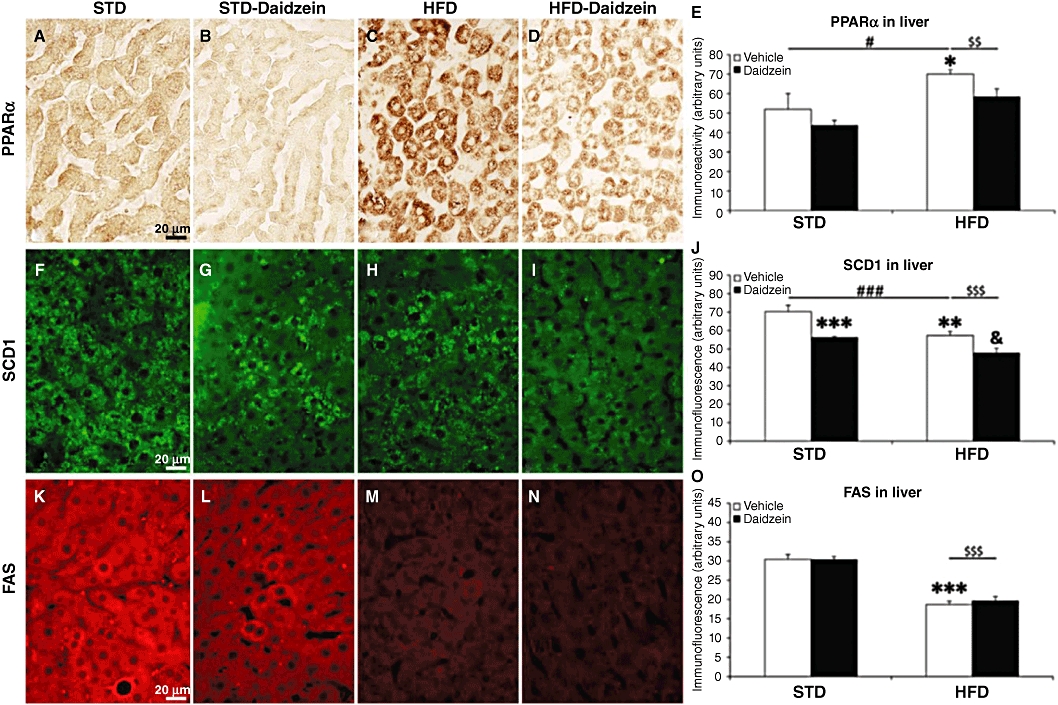
Effects of diet and daidzein treatment (50 mg·kg−1, 14 days) on protein expression of PPARα, SCD1 and FAS in liver by immunohistochemistry, immunofluorescence and densitometry. Representative high-magnification images from liver samples, immunostained for PPARα (A–D), SCD1 (F–I) and FAS (K–N) in the four rat groups (STD, STD-daidzein, HFD, HFD-daidzein). Quantification of densitometry showed an increase of PPARα expression in HFD (E), a decrease of SCD1 expression in HFD that was accentuated after daidzein treatment in both diets (J), and a decrease of FAS expression in HFD (O). Histograms represent the mean ± SEM (eight animals per group). Two-way anova followed by Bonferroni post hoc test: *P < 0.05, **P < 0.01, ***P < 0.001 versus vehicle-treated STD group, &P < 0.05 significantly different from vehicle-treated HFD group, $$P < 0.01, $$$P < 0.001 for diet effect, #P < 0.05, ###P < 0.001 for daidzein effect. Scale bar is shown in (A), (F) and (K). Diet, treatment and interaction effects are summarized in Table S3.