
Figure 10.
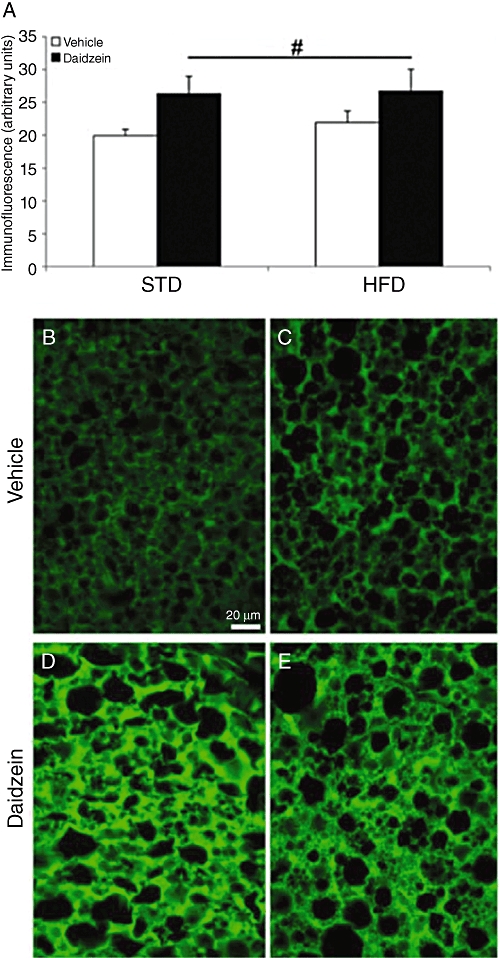
Effects of diet and daidzein treatment (50 mg·kg−1, 14 days) on protein expression of UCP1 in brown adipose tissue by immunofluorescence and densitometry. Quantification of densitometry only showed a significant increase of UCP1 expression after daidzein treatment (A). Representative high-magnification images from the brown adipose tissue immunostained for UCP1 in the four rat groups (STD, STD-daidzein, HFD, HFD-daidzein; B–E). Histograms represent the mean ± SEM (eight animals per group). Two-way anova followed by Bonferroni post hoc test: #P < 0.05 for daidzein effect. Scale bar is shown in (B).