Figure 1.

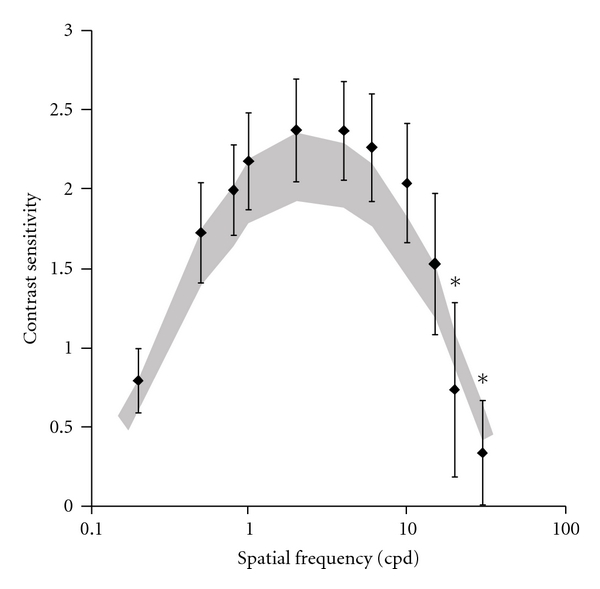
Mean spatial luminance contrast sensitivity at 11 spatial frequencies. Black diamonds represent the gas station workers contrast sensitivity and dark area represents the interval of confidence of control group.

Mean spatial luminance contrast sensitivity at 11 spatial frequencies. Black diamonds represent the gas station workers contrast sensitivity and dark area represents the interval of confidence of control group.