Figure 3.

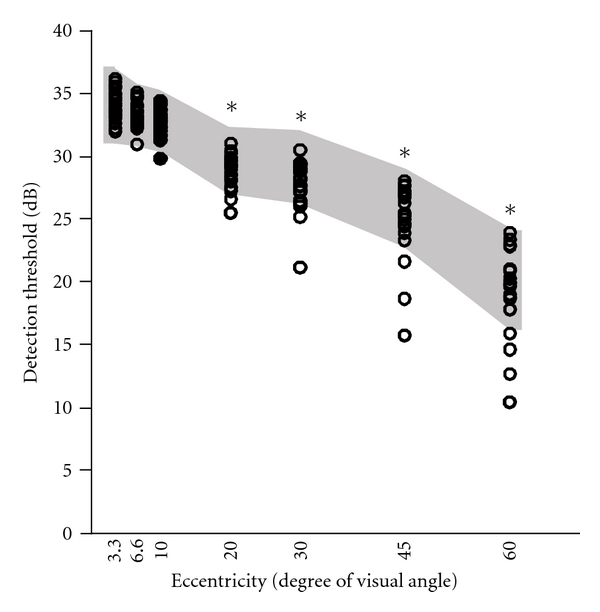
Detection threshold estimated by visual perimetry. Detection threshold as function of visual field eccentricity. Dark area represents the tolerance interval of detection thresholds of the control group.

Detection threshold estimated by visual perimetry. Detection threshold as function of visual field eccentricity. Dark area represents the tolerance interval of detection thresholds of the control group.