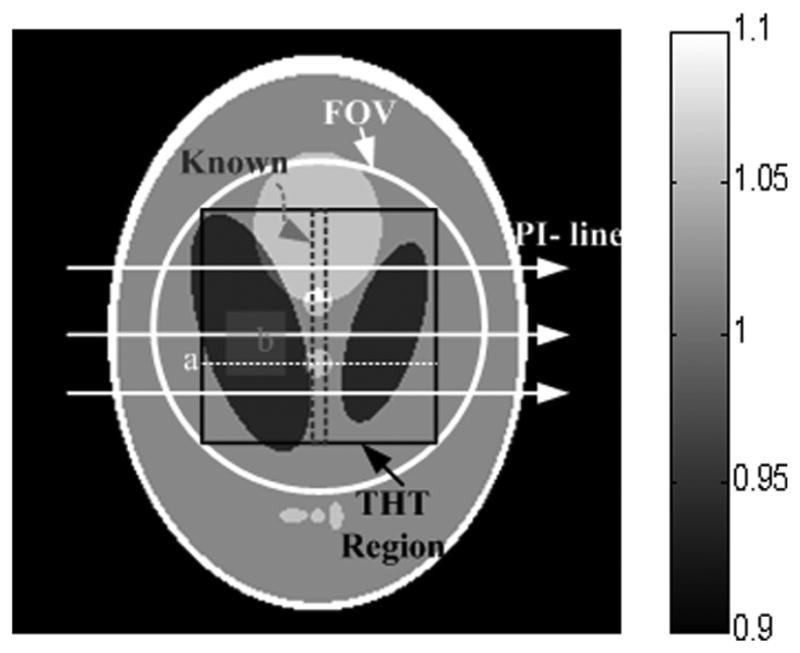
Fig. 1.

2D Shepp–Logan phantom within a display window [0.9 1.1]. The circular region indicates the FOV which is the ROI in SIRCS, the inscribed square indicates the ROI in THT, and the central stripe is known. The PI-lines were reconstructed along the horizontal direction, and the line labeled “a” and the region labeled “b” were used to evaluate the image quality.
