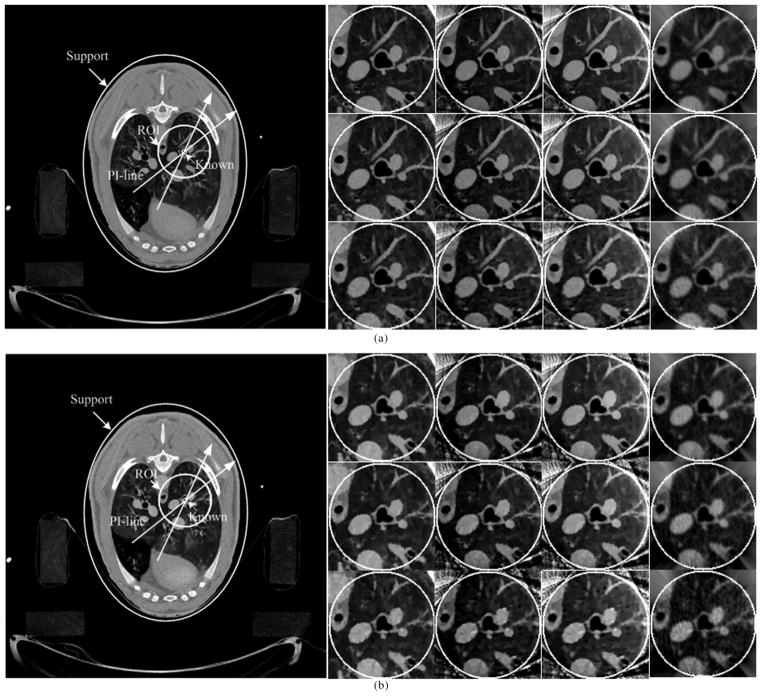
Fig. 5.
Reconstructed images in the nonhuman experiments. (a) and (b) The results from normal and low dose datasets, respectively. The left large images were reconstructed from full-scan datasets to show the ROIs and PI-lines. Among the right small images, the first, second, and third rows are the results from 1160, 580, and 290 views, respectively; the first column is the results obtained from a full-scan dataset using SIRCS-Zero, and second, third, and fourth columns are the results from a truncated dataset using SIRCS-THT, SIRCS-Zero and THT, respectively. The display window is [−700HU 800HU].

