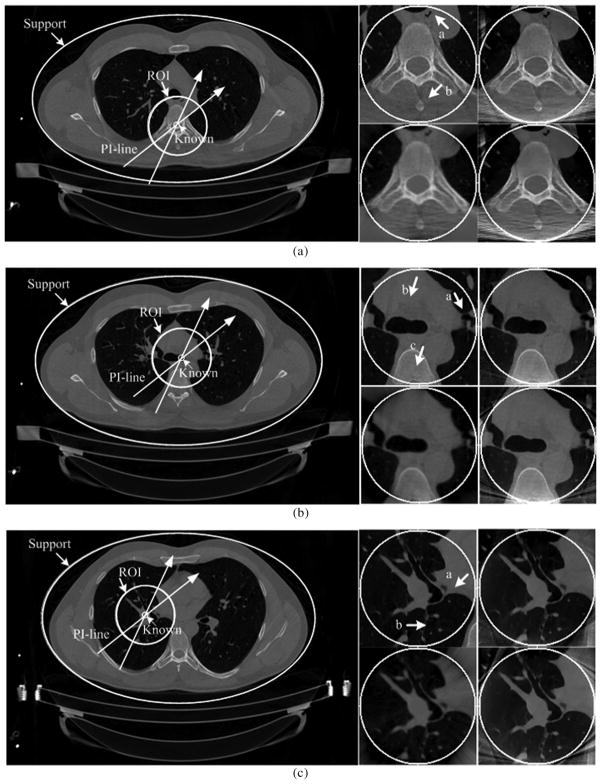
Fig. 9.
Reconstructed images in the human experiment. (a), (b), and (c) The results of different Slices 1–3, respectively. The left large images were reconstructed from the full-scan datasets to show the ROIs and PI-lines. The ROI in Slice 1 contains a bony structure. The ROI in Slice 2 is mainly soft tissue. Most of the ROI in Slice 3 is a cavity. Among the right small figures, the upper left, upper right, lower left, and lower right images are the reference ROI, the ROI reconstructed using SIRCS-THT, THT, and SIRCS-Zero (for Slice 2 and 3)/NSIRCS-THT (for Slice 1), respectively. (a) Slice 1. (b) Slice 2. (c) Slice 3.

