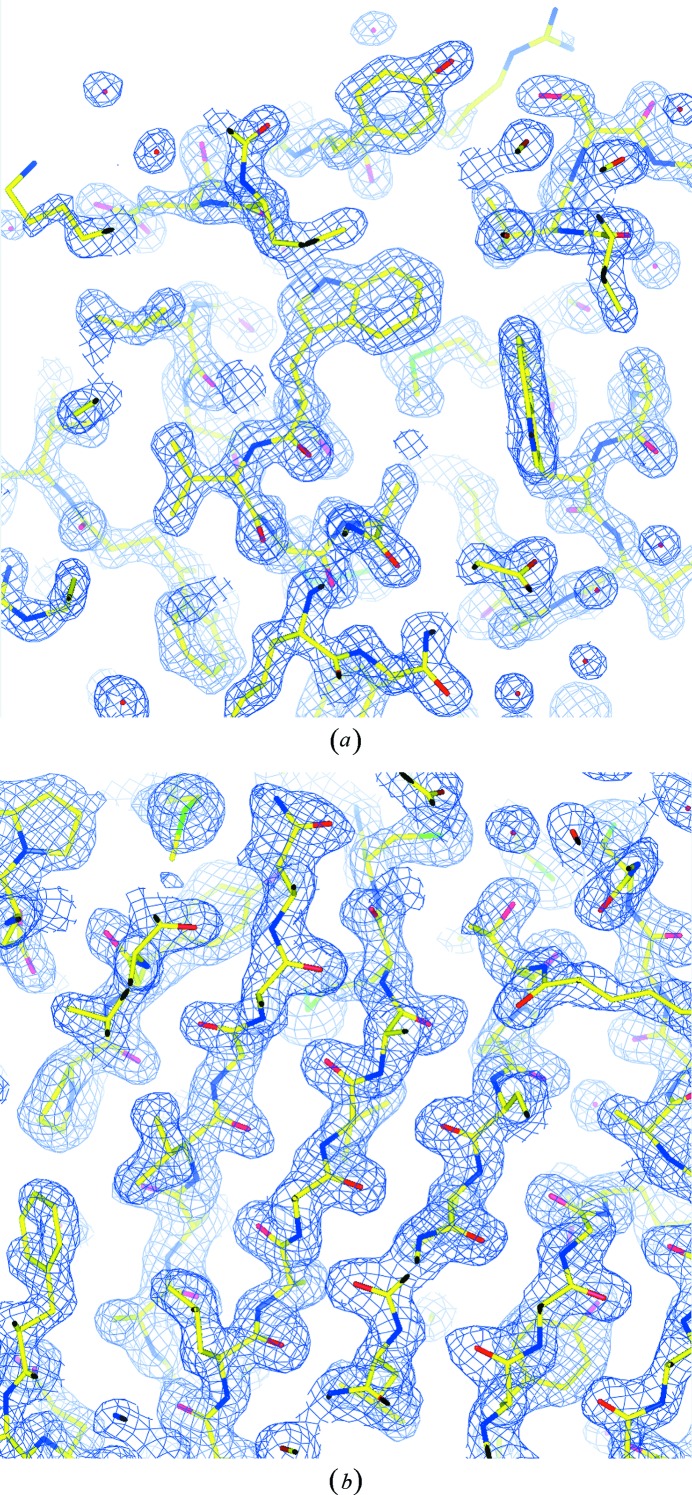
Figure 9.
(a) σA-weighted 2 electron-density map of lysozyme Hg derivative calculated at 1.7 Å resolution. Contour level is 1.5 r.m.s. A molecular model after crystal structure refinement is superimposed on it. (b) Electron-density map of TTHA0593 calculated at 1.9 Å resolution. Phases were improved by density modification after SAD phasing was used. Contour level is 1.5 r.m.s. A refined structure model is also shown.

