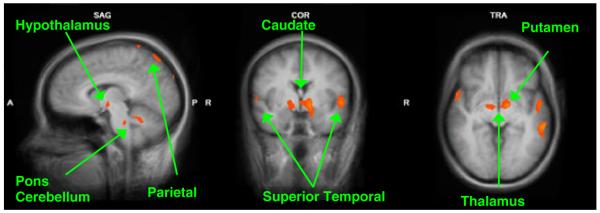
Figure 2.
Maternal brain activity for VD vs. CSD for (Own baby-cry > Other baby-cry) (x = 7, y = −3, z = −4). These are sample views of the group comparison of mothers who delivered by vaginal delivery (n = 6) vs. Cesarean section (n = 6) for the contrast of own baby-cry vs. other baby-cry (p < .005, uncorrected). Please see Table 2 for a detailed list of corrected activations

