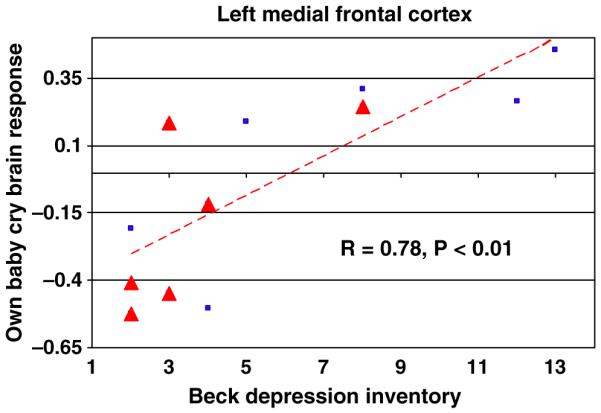
Figure 4.

OWN > OTHER baby-cry vs. BDI in mothers (VD + CSD). This scatter-plot shows the relationship between BDI scores and the functional magnetic resonance imaging (fMRI) response at the local maxima in the left medial frontal (Brodmann Area 10, −16,56,20) region for own baby-cry vs. other baby-cry (r = .73, p < .01). Red triangles indicate CSD mothers, blue squares indicate VD mothers
