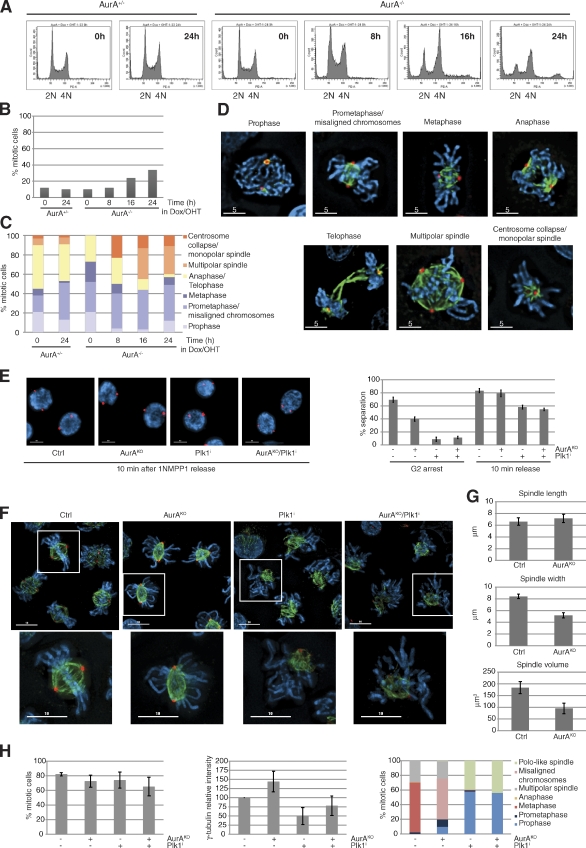
Figure 1.
AurA-depleted cells exhibit substantial chromosome alignment defects in early mitosis. (A) FACS profiles of AurA+/− and AurA−/− cells incubated with doxycyclin (Dox)/4-hydroxytamoxifen (OHT). (B) Mitotic index (n ≥ 237 cells for each condition, three independent experiments). (C) Cells from B classified into different mitotic stages (n ≥ 29 cells for each condition). (D) Representative pictures of mitotic cells counted in C. (E) Centrosome separation analysis. Cells were synchronized in G2 with or without AurA according to the procedure described in Fig. S1 E, with or without the Plk1 inhibitor BI2536. Cells with separated centrosomes were scored in G2 and 10 min after 1NMPP1 washout. Representative pictures and quantifications are shown (n = 100 cells for each condition, three independent experiments). (F) Images of cells immunostained 30 min after 1NMPP1 release. The boxes in the larger images are further magnified below. (G) Spindle analysis. Pictures from F were processed by 3D rendering to determine the spindle pole distance, width, and volume (n ≥ 75 cells for each condition, three independent experiments). (H) Quantitative data of results in F. The mitotic index (left), γ-tubulin intensity measurements (middle), and quantification of mitotic phenotypes (right) are shown (n ≥ 75 cells for each condition, three independent experiments). γ-Tubulin (red), α-tubulin (green), and DNA (blue) are shown. Bars: (D) 5 µm; (E and F) 10 µm. Error bars indicate means ± SD. Ctrl, control; PE-A, phycoerythrin area.

