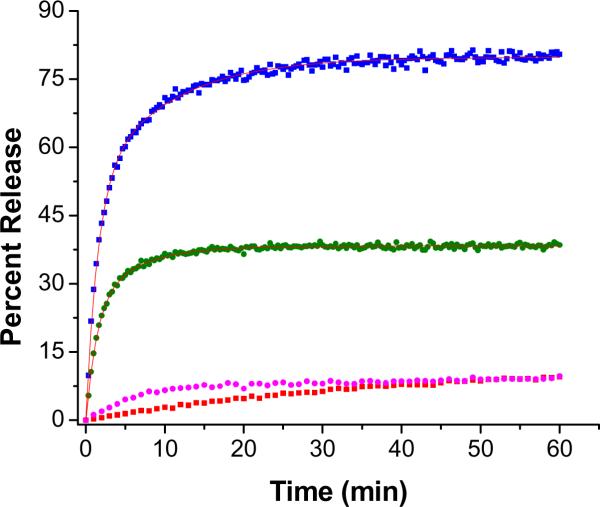
Figure 4.
The release profiles for liposome-encapsulated carboxyfluorescein (λex = 480 nm; λem = 518 nm) in the presence and absence of 2.3 μM MMP-9 in 25 mM HEPES buffer, pH = 8.0 containing 100 mM NaCl, 10 mM CaCl2 and 10 mM ZnCl2 for POPC liposomes incorporating 20 mol% (blue squares) and 10 mol% of lipopeptide GPO3 (green circles). The background releases of the dye in the absence of the enzyme are also shown (red squares: 20 mol% GPO3; magenta circles: 10 mol% GPO3). The lines through the release profiles are the fitted curved using a biexponential rate equation.

