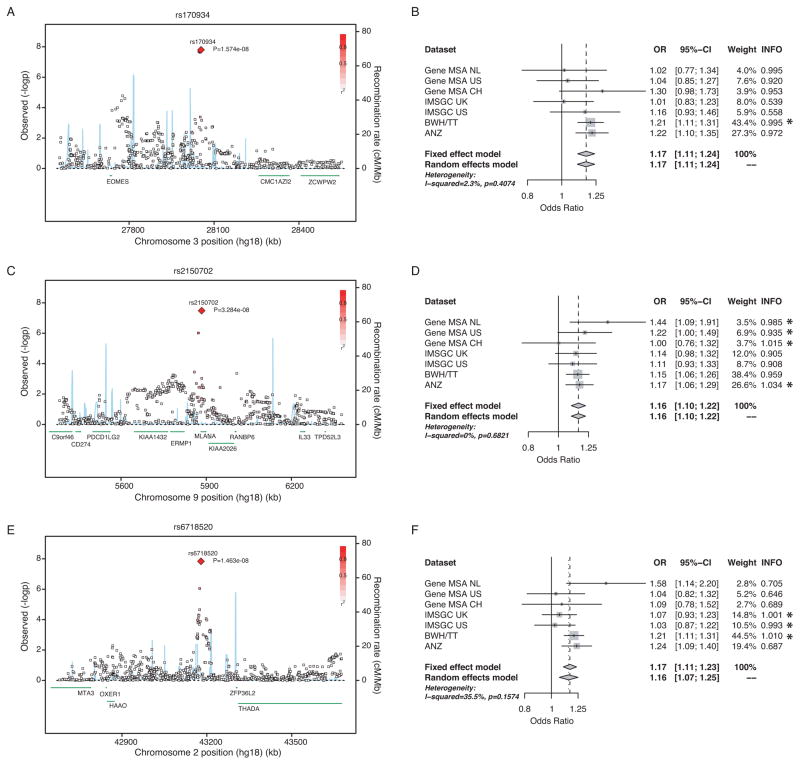
Figure 2. Regional association plots for the newly identified genome-wide significant loci and respective forest plots.
(A, B) rs170934 in EOMES, (C, D) rs2150702 in MLANA, and (E, F) rs6718520 near THADA. Regional plots: The X axis plots 1 million basepairs around the most statistically significant (index) SNP, which is highlighted by a large red diamond. r2 of a given SNP with the index SNP is illustrated with the intensity of the red color. The blue line represents the recombination rate. Each square represents one SNP. Forest Plots: The per-datasets’ weights are from the fixed effects meta-analysis. The p-value is for the Cohran’s Q test for statistical heterogeneity. INFO score is an imputation quality metric, corresponding to the ratio of observed vs. expected allele frequency. Values greater of 0.8 indicate high imputation quality. Genotyped SNPs have a value of 1. SNPs that were genotyped in a given dataset are marked with an asterisk.

