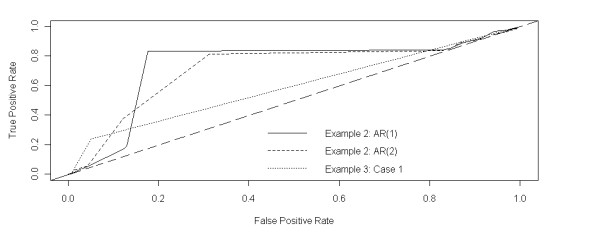
Figure 3.

Roc curve. The True Positive Rate is computed by the number of probes with true nonzero log2 ratios divided by the total number of probes detected in the aberration region. The False Positive Rate is computed by the number of probes with true zero log2 ratios divided by the total number of probes detected in the aberration region. Three curves are plotted for AR(1) and AR(2) model in Example 2 and Case 1 in Example 3, respectively.
