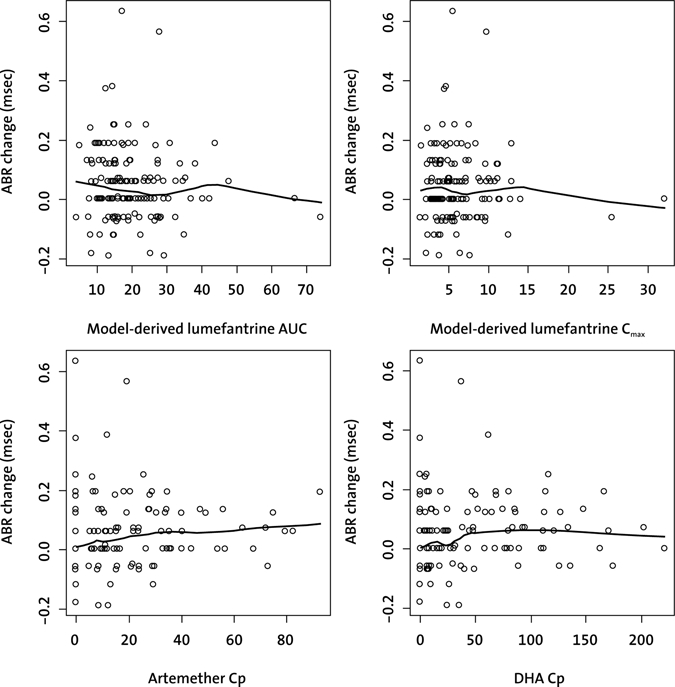
Figure 1.

ABR Wave III latency change (msec) from baseline to Day 7 versus artemether, DHA, and lumefantrine exposure. The largest ABR change of both ears was considered for presentation. The black line represents the LOWESS smoother showing the general trend of the exposure—ABR change relationship. ABR = auditory brainstem response; AUC = area under the plasma concentration-time curve (mg.d/L); Cmax = maximum plasma concentration (mg/L); DHA = dihydroartemisinin; Cp = plasma concentration at 1 hour after the last artemether-lumefantrine dose (ng/mL).
