
Figure 2.
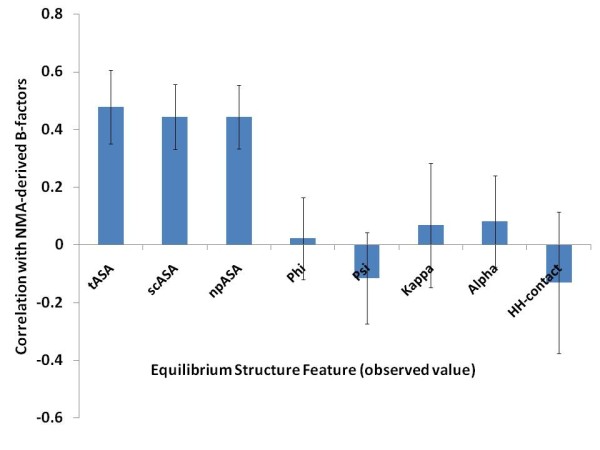
Correlation between the equilibrium structural feature (ESFs) and the NMA-derived B-factors. Correlation coefficients were calculated for each protein and averaged for the plot. Error bars represent the standard deviation of the protein-wise correlation coefficients. Predicted B-factors from the El Nemo web server were used for this analysis, which was based on the displacements observed in the 100 lowest-frequency modes.