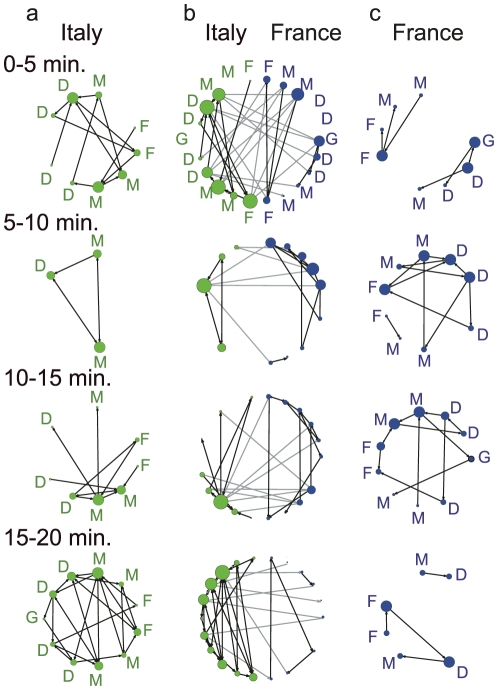
Figure 4. Wiring diagrams for a football game.
All diagrams represent each player as a vertex and each pass as a link in each 5-min interval in the first 20 min of the first half. The size of each vertex shows its degree. France received a penalty kick and scored in the seventh minute. Italy scored in the 19th minute after a corner kick. The black line shows the tracking of the ball handling during each 5-min interval for the same team. a. Intra-group network for Italy. b. Inter-group network for both teams. The gray line also shows the tracking of the ball between teams. c. Intra-group network for France. G, D, M, and F denote goalkeeper, defender, midfielder, and forward, respectively, according to the 4-4-2 system of play, regardless of the system actually chosen by each team.

