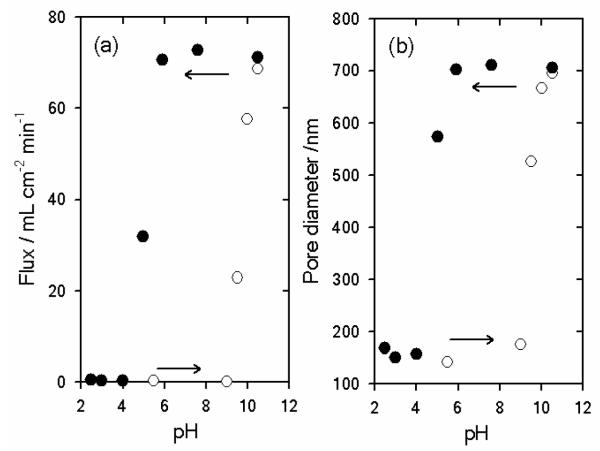
FIGURE 10.
Changes in flux (a) and pore diameter (b) as a function of pH. The filled and open circles represent data generated after a pH 10.5 pretreatment and after a pH 2.5 pretreatment, respectively. Reproduced and adapted with permission from Lee et al. J. Am. Chem. Soc. 2006, 128, 8521. Copyright 2006 American Chemical Society.

