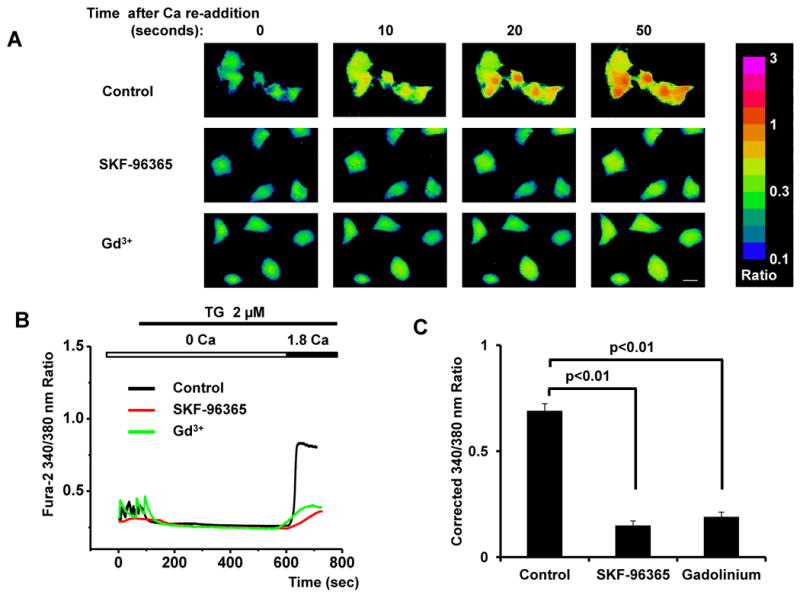
Figure 1. Robust SOCE in NRVMs.

(A) Representative images of SOCE in neonatal cardiomyocytes depicted as Fura-2 ratios (340/380 nm) of Ca2+ concentration, as well as inhibition by SKF-96365 (10 μM) and Gd3+ (25 μM); time marks commence with Ca2+ re-addition; scale bar, 10 μm. (B) Representative traces of Ca2+ concentration demonstrating the time course of SOCE. (C) Quantitative analyses of SOCE shown as average peak Ca2+ levels after restoration of extracellular Ca2+ (1.8 mM) (corrected for baseline values, i.e. those before initial depletion of Ca2+ stores) from control, SKF-96365- and Gd3+-treated cardiomyocytes (n=18-22 cells) in three independent experiments.
