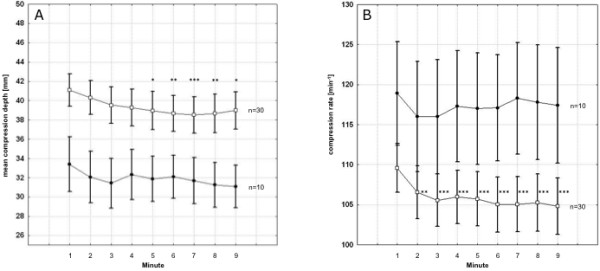
Figure 2.

Minute-to-minute compression depth (A) and rate (B) during external chest compression performed by male (n = 30) and female (n = 10) participants. A: Compression depth, male vs. female: p = 0.04; B: Compression rate, male vs. female: p = 0.1. Squares = male participants; black circles = female participants. Asterisks indicate significant differences comparing the first minute with the subsequent minutes of compression within each group. *: p < 0.1; **: p < 0.05; ***: p < 0.01. Data are presented as mean ± standard error of mean.
