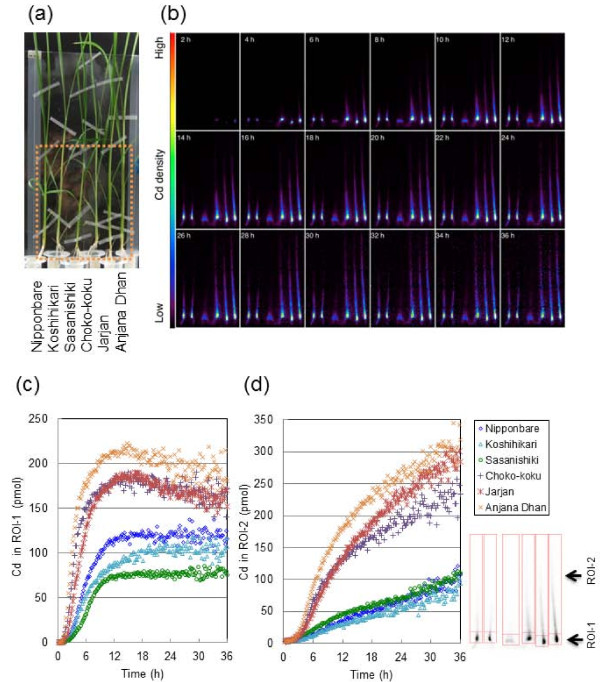
Figure 2.
Imaging and analysis of107Cd transport into shoots of six rice cultivars (vegetative stage). (a) Photograph of test plants. The large dotted rectangle indicates the FOV of PETIS. (b) Serial images of Cd movement (0-36 h). (c) Time course of Cd amounts in ROI-1 (shoot bases). (d) Time course of Cd amounts in ROI-2 (leaf sheaths and leaf blades). The relevant portion of each ROI is surrounded by red lines in the black and white photograph. Cd in ROI-1(pmol) and Cd in ROI-2(pmol) in Figure 2 indicate the sums of radioactive107Cd and nonradioactive Cd.

