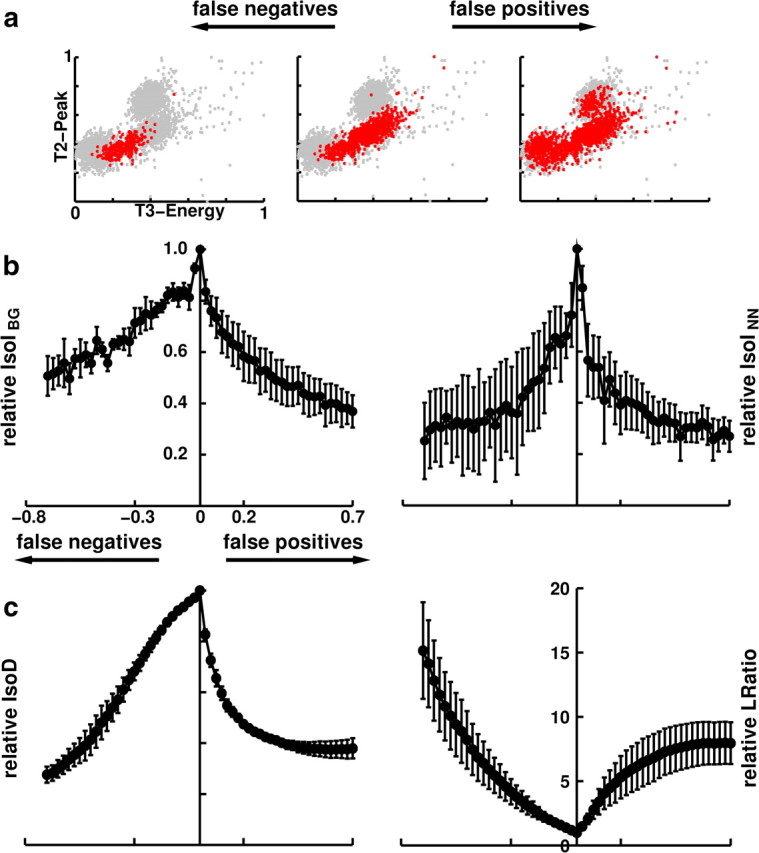
Figure 3.

Correlation of IsoI measures with error rates. a, False positives (right) and false negatives (left) were incrementally added to the known IC feature distribution, and the corresponding relative IsoI values were calculated. The cluster displayed has 833 feature vectors. b, Correlation of relative IsoIBG and IsoINN values with false-positive and false-negative error rates were found to be large and significant (p < 0.001). Peak IsoI value occurs at zero error rate. Error rates were defined by the percentage of points added to (false positives) and subtracted from (false negatives) the IC cluster. At high error rates, variability of relative IsoI values increased, but IsoI values remained non-negative. c, Correlation of relative IsoD and LRatio values with false-positive and false-negative error rates were found to be significant (p < 0.001). Note that LRatio increases with increasing error rate, indicating a drop in single-unit isolation quality.
