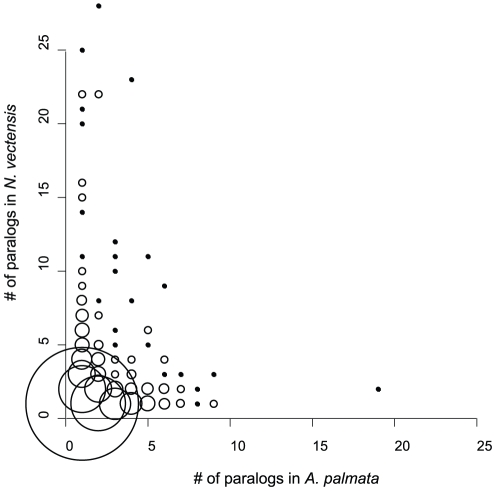
Figure 6. Distribution of paralog groups identified between A. palmata and N. vectensis by inparanoid.
Plotting on a gene by gene basis showed that genes with large numbers of paralogs (>5) differed between species. Groups with a single member from each species were most common, and Groups with >5 members each accounted for less than 0.5%. Only a single group with >9 members was found in A. palmata. Circle size is proportional to the number of groups of a given size class.

