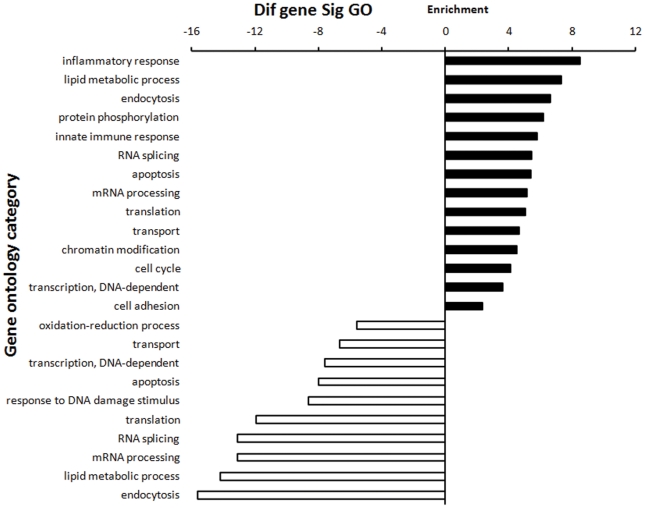
Figure 3. DGE (M28 versus M5-90 libraries) GO enrichment chart.
The upper chart comprises GOs targeted by overexpressed DEGs; the lower chart comprises GOs targeted by downregulated DEGs. All these GOs show increased enrichment. The vertical axis is the GO category and the horizontal axis is the enrichment of GO.

