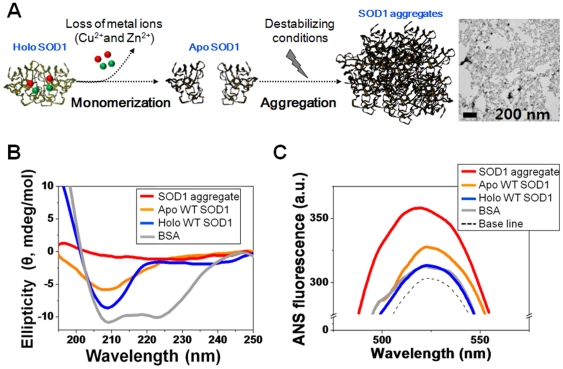
Figure 2. Schematic illustration of SOD1 aggregation and its characteristics.
(A) A scheme for the aggregation of SOD1. Inset is a shape of as-prepared SOD1 aggregate. Bars, 200 nm. (B) CD spectra and (C) ANS fluorescence intensities for proteins (Red, SOD1 aggregates; orange, apo WT SOD1; blue, holo WT SOD1; grey, BSA).; All protein samples were prepared in PBS at a concentration of 0.1 mg/mL. SOD1 aggregates were taken after incubation with TFE for 5 days, and then characterized.

