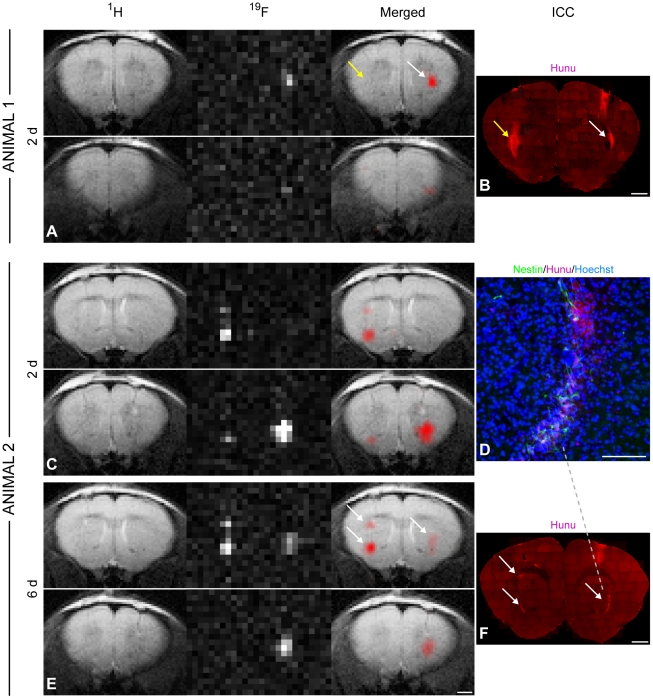
Figure 3. In vivo 19F MRI and correlation with immunohistochemistry.
1H, 19F, and merged MR images of a mouse (Animal 1), which had been injected with non-labeled control cells into the left striatum and labeled NSCs into the right hemisphere (A). Only the labeled cells generated a 19F signal whereas hunu staining confirmed the presence of cell grafts on both sides as indicated by the arrows (B). MRI of another mouse (Animal 2) 2 days (C) and 6 days (E) after grafting showed no major signal loss in the 19F images over time. This animal had received two deposits of labeled cells in the left striatum and one deposit in the right striatum. The location and intensity of 19F signal from cell clusters, marked with white arrows, correlated well with hunu staining on histological sections. Note that the 19F resolution allows the distinction of the two clusters on the left hemisphere (B, F). Only cells that were clearly immunoreactive to both hoechst and hunu were considered as grafted human NSCs (D). Scale bars are 50 µm for D, 1 mm for all others.

