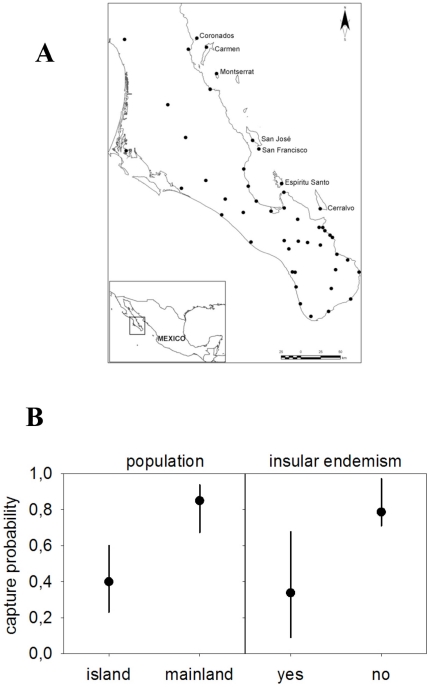
Figure 1. The study area and the capture probability of lizards are showed.
A. Study area. The Southern half of the Baja California peninsula and seven islands from Gulf of California. We visited 35 peninsular localities and eight on the islands.B. Capture probability of A. hypertythra lizards from 2004–2006 in Baja California. Data are least squares means (and 95% CL) from GLMM models controlling for locality and cat presence, back transformed to a probability using the inverse logit. The left panel refers to the analysis based on populations while the one on the right refers to the analysis focusing on the category of the species (insular endemic or not) present at each capture site.

