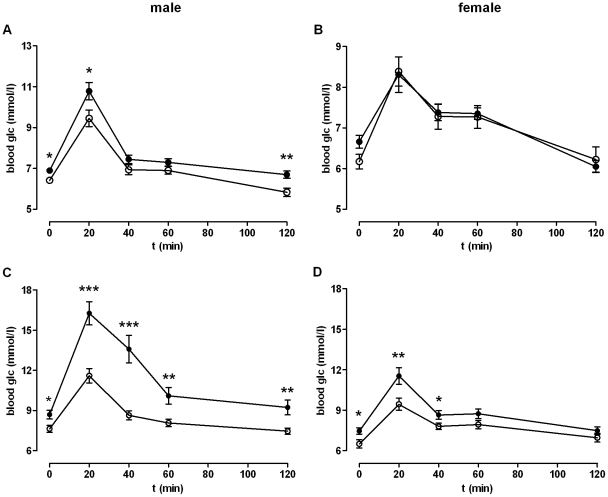
Figure 3. Oral glucose tolerance test (oGTT).
An oGTT was performed after a starving period over night by oral application of 80 mg glucose. WT data are given as black dots, KO data as open dots. Blood glucose was measured before (given as 0 min) and 20, 40, 60 and 120 min after glucose application. (A) In male KO animals (n = 22) the blood glucose at 0 min was significantly lower compared to WT male mice (n = 25). The glucose levels at 20 and 120 min after glucose application increased in KO male mice but were also significantly lower than in WT male mice. (B) Female KO mice (n = 10) did not show any differences in their blood glucose levels compared to WT females (n = 17). OGTT was also performed with (C) male (WT/KO n = 19/15) and (D) female mice (WT/KO n = 21/14) after a 12 week Western diet. Results are given as mean ± SEM. *P<0.05, **P<0.01, ***P<0.001.

