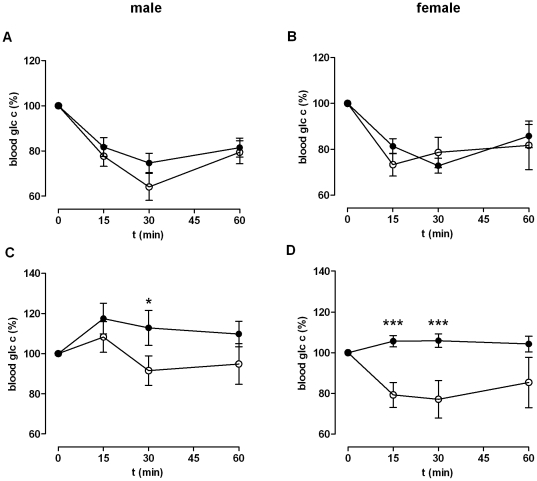
Figure 4. Insulin tolerance test (ITT).
An ITT was performed by i.p. application of 0.75 U insulin/kg body weight. WT data are given as black dots, KO data as open dots. Blood glucose was measured before (given as 0 min) and 15, 30, and 60 min after insulin application. (A) In male KO animals (n = 7, blood glucose0 min 7.01±0.22 mmol/l) the change of blood glucose concentration did not show any differences compared to male WT (n = 11, 6.75±0.52 mmol/l). (B) Similar, female KO (n = 12, 6.26±0.29 mmol/l) did not show any differences in their blood glucose levels compared to female WT (n = 12, 5.38±0.32 mmol/l). ITT was also performed with (C) male mice (WT/KO, n = 13/12, 8.33±0.74/5.57±0.36 mmol/l) and (D) female (WT/KO, n = 15/13, 6.75±0.21/6.45±0.25 mmol/l) after a 12 week Western diet. Changes in blood glucose concentration are given as mean ± SEM. *P<0.05, **P<0.01, ***P<0.001.

