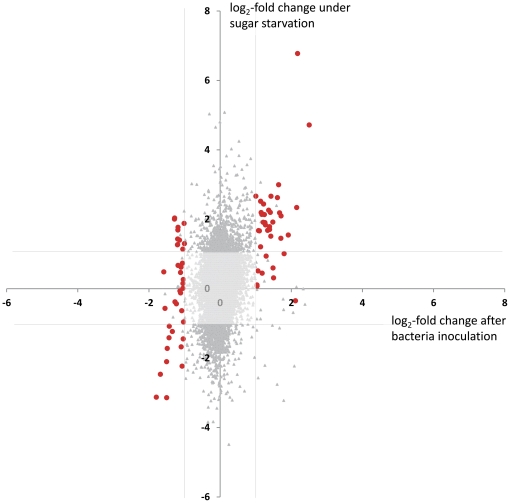
Figure 5. Comparison of log2-fold expression values of genes between a 6 h P. sp. G62 inoculation (x-axis) and 3 h of sugar starvation (y-axis,
[42] ). Genes marked in red are significantly regulated by bacteria (Table 1) with a log2-fold change <−1 or >1. Lines parallel to the axes indicate log2-fold change of 1 or −1.

