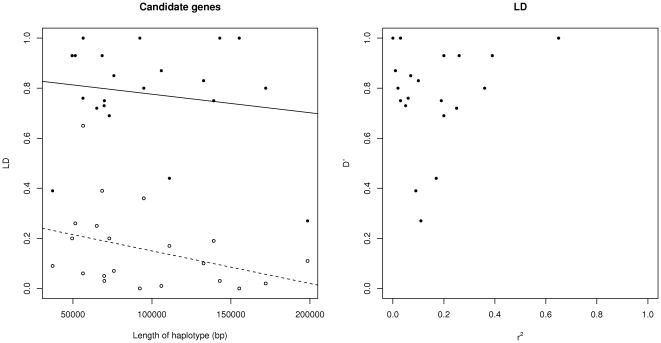
Figure 1. Comparison of linkage disequilibrium (LD) measures for the genes in the study.
A. D′ and r 2 plotted against distance between SNPs. D′ values are filled black circles, r 2 values are open black circles. Least squares fitted regression lines of LD on length of haplotype (D′ solid line, r 2 dashed line) are not statistically significant and the slopes are b<−1×10⁻⁵. This is evidence that the length differences between haplotypes are not important in accounting for LD between SNPs in this sample of genes. Values are means of LD estimates for each breed, not calculated from a sample of mixed breed individuals. B. Plot of D′ against r 2 for the genes in this study. Most of the comparisons between pairs of SNPs show high D′and low r 2 values, a typical result for cattle at this distance between SNPs. High D′values can indicate a reduced number of haplotypes or classes of haplotypes that are missing. r 2 values are useful in describing how well the genotypes at one SNP predict the genotypes at the other SNP.

