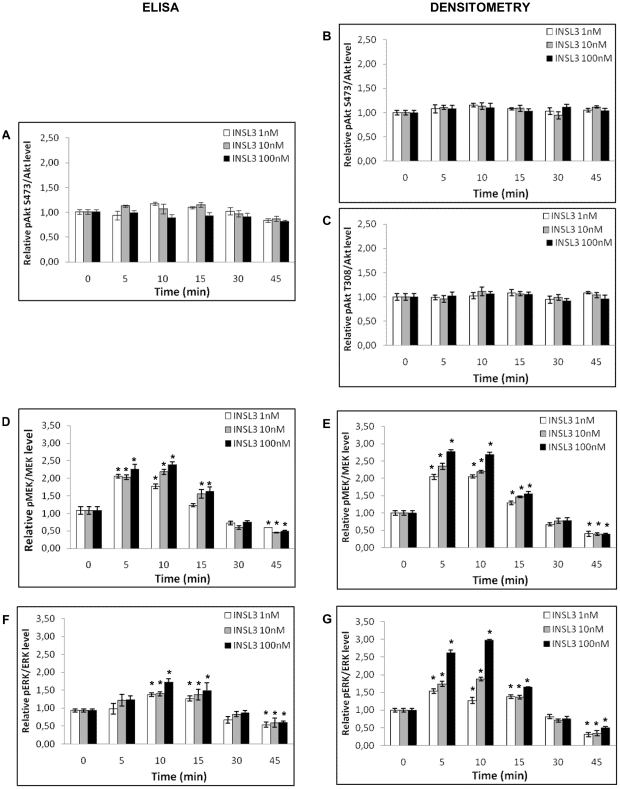
Figure 3. Quantitative phosphorylation analysis of Akt, MEK, and ERK in human osteoblasts induced by INSL3.
Quantitative analysis on Akt phosphorylation: A. ELISA at S473, B. densitometric analysis at S473 and C. densitometric analysis at T308. Quantitative analysis on MEK phosphorylation: D. ELISA and E. densitometric analysis. Quantitative analysis on ERK phosphorylation: F. ELISA and G. densitometric analysis. ELISA data are shown as the mean ± standard deviation (SD) of the mean of three different experiments performed in triplicate. Densitometric data are shown as the mean ± standard deviation (SD) of the mean of three different experiments. * P<0.05 vs control.

