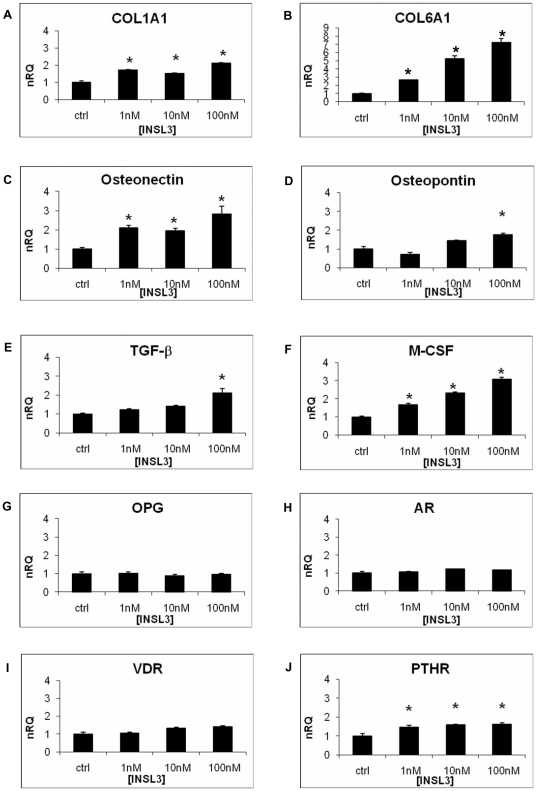
Figure 5. Quantitative RT-PCR on osteoblasts stimulated with INSL3.
A. COL1A1, B. COL6A1, C. Osteonectin, D. Osteopontin, E. TGF-β, F. M-CSF, G. OPG, H. AR, I. VDR, J. PTHR. Quantification was normalized to the expression of the housekeeping gene β2-microglobulin on control (no stimulation). Data are shown as the mean ± standard deviation (SD) of the mean of three different experiments performed in triplicate. * P<0.05 vs control. nRQ: normalized Relative Quantity. Ctrl: Control.

