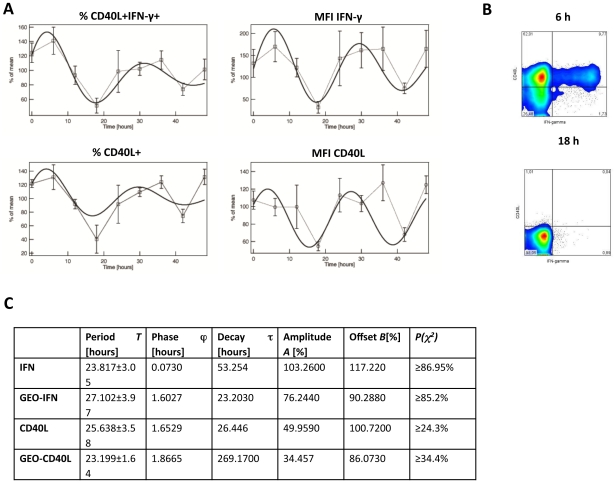
Figure 5. Circadian immune response of stimulated CD4+ T cells in vitro.
Blood was sampled from four healthy young males at 10 AM. CD4+ T cells were isolated from whole blood by MACS technology and the purified CD4+ T cells (mean purity: 91.14%±0.82%) were subsequently cultured in serum-free medium and stimulated with PMA/ionomycin. A) Depicts the expression (GeoMean) as “percent of mean” of IFN-γ (mean = 207.74) and CD40L (mean = 54.56) per cell as well as the “percent of mean” of the percent of CD40L+CD4+(mean = 63.16%) and CD40L+IFN-γ+ CD4+ T cells (mean = 9.8%). The x-axis reflects the time cells were in culture. The statistical analyses of the fitting are shown in the table (C). The p-values calculated by Cosinor analysis are depicted in Table. S2. B) Shows two FACS plots of one donor at the peak and trough of IFN-γ production (time point as indicated).

