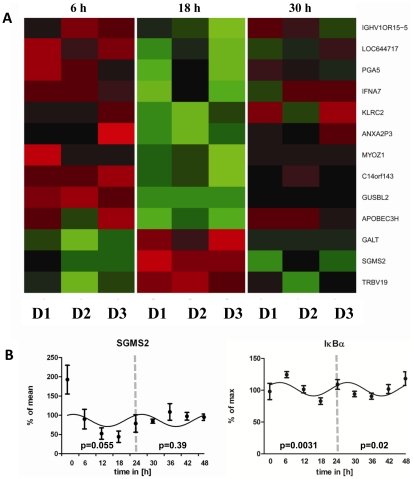
Figure 6. Circadian microarray and qPCR analysis of stimulated CD4+ T cells in vitro.
Blood was sampled from three healthy young males at 10 AM. CD4+ T cells were isolated from whole blood by MACS technology. Aliquots of purified CD4+ T cells (mean purity: 90.94%±0.46%) were cultured up to 48 h. For microarray analysis aliquots were taken out in 6 h intervals and stimulated. Cells were stimulated 3 h with PMA/ionomycin. At the first and second peak as well as at the first trough of IFN-γ production cells were harvested for microarray analysis to identify candidate genes involved in the circadian regulation of IFN-γ production. A) Heat map of candidate genes identified by ANOVA. B) qPCR was performed from all time points (9 time points over 48 h) for SGMS2 and IκBα. The p-values depicted in each graph were calculated by Cosinor analysis (Table. S2). The x-axis reflects the time cells were in culture. The dashed line splits the first and second 24 h period. P-values were separately calculated for the first and second 24 h and are depicted respectively.

