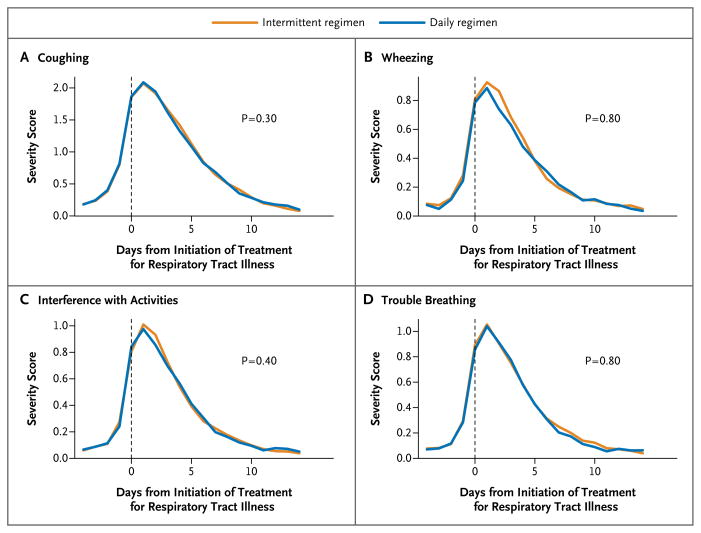
Figure 3. Profiles of Symptom Severity during Respiratory Tract Illness.
Day zero corresponds to the start of treatment for a respiratory tract illness. P values are for comparisons of symptom levels during the first 14 days after the initiation of treatment for respiratory tract illness, with adjustment for baseline symptom levels (on days 13 to 7 before the initiation of treatment). Plotted values are means for the indicated day. Scores range from 0 to 5, with higher scores indicating more severe symptoms.

