Figure 4.
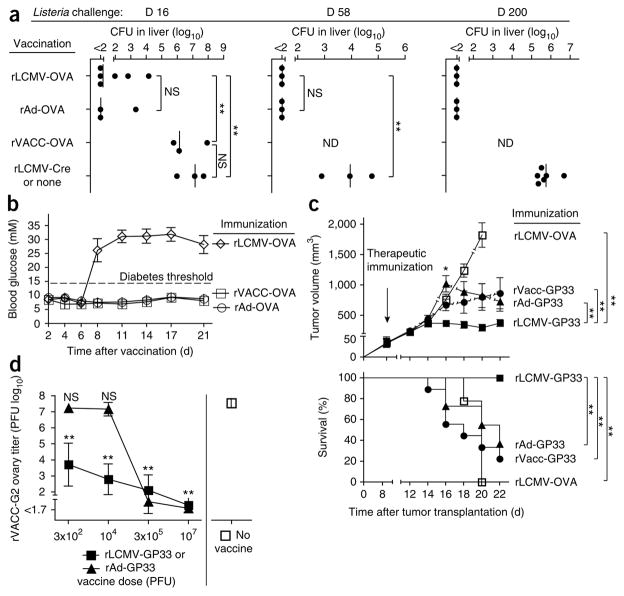
Efficacy and protective capacity of rLCMV-induced CTL responses. (a) Bacterial titers in the livers of C57BL/6 mice vaccinated with rLCMV-OVA, rAd-OVA or VACC-OVA, then challenged with rLM-OVA 16 or 58 d after single immunization or 200 d after homologous prime-boost vaccination (days 0 and 38); titers were measured 3 d after challenge. Immunization with rLCMV-Cre (challenge on day 16 or 58) and no immunization (challenge on day 200) serve as controls. Each symbol represents an individual mouse; small vertical lines indicate the mean. (b) Blood glucose concentrations of RIP-OVA-transgenic mice transfused with 1 × 10³ OT-I TCR-transgenic splenocytes on day -1 and immunized with rLCMV-OVA, VACC-OVA or rAd-OVA on day 0. Data are from one representative of two experiments (mean ± s.e.m. of three to six mice). (c) Tumor volume and survival of C57BL/6 mice injected subcutaneously in both flanks with 5 × 10⁵ B16.F10 melanoma cells expressing the CTL epitope GP33 (ref. 19); 8 d later, tumor masses were palpable, and rLCMV-GP33, rAd-GP33 or VACC-GP33 was given for immunotherapy. Immunization with rLCMV-OVA serves as a control. Tumor volume was calculated by the formula V = π × abc/6, where a, b and c are the orthogonal diameters. For survival analysis, death and humane endpoints (tumor volume, tumor exulceration, cachexia) were counted as events. Broken lines (top) indicate loss of mice to follow-up (bottom), which caused a bias toward smaller tumors at subsequent time points. Data are representative of initially 18–22 tumors from 9–11 mice per group (mean ± s.e.m.). (d) Viral titers in the ovaries of C57BL/6 mice vaccinated with rLCMV-GP33 or rAd-GP33 (dose, horizontal axis) or left untreated, then given 2 × 10⁶ PFU of VACC-G2 intraperitoneally 18 d later and killed 6 d later. Statistical analysis identifies groups that differ significantly from unvaccinated controls. Data are representative of five mice (mean ± s.d.). P values of less than 0.01 (**) were considered highly significant.

