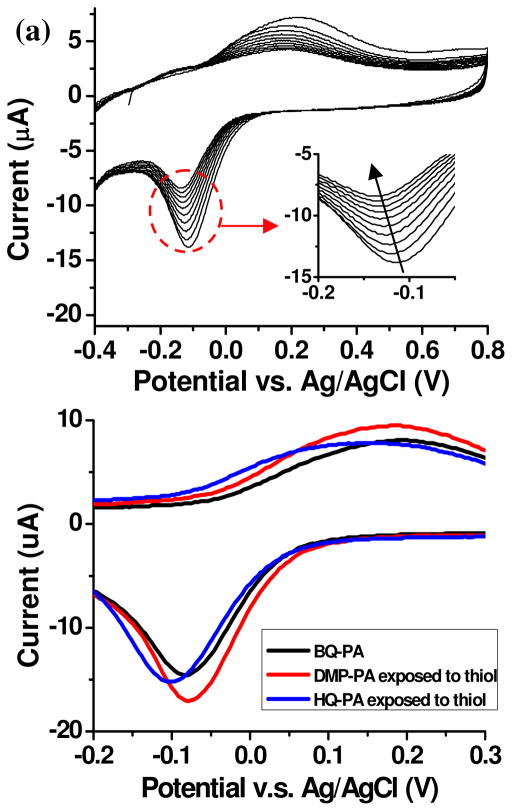
Figure 2.
(a) The first 10 CV scans of a BQ-PA monolayer in presence of 10 μM 3-mercaptopropanol (in PBS, pH 7.4). The peak current decreases during the scans. Inset: The region of the reduction peak. The arrow indicates the shift of the peak current during the 10 scans. (b) CV characterization of ITO samples with BQ-PA monolayer (black), DMP-PA monolayer after exposed to thiols (red) and HQ-PA monolayer after exposed to thiols (blue). The DMP-PA monolayer was first subject to an oxidative potential at 950 mV before CV measurement.

