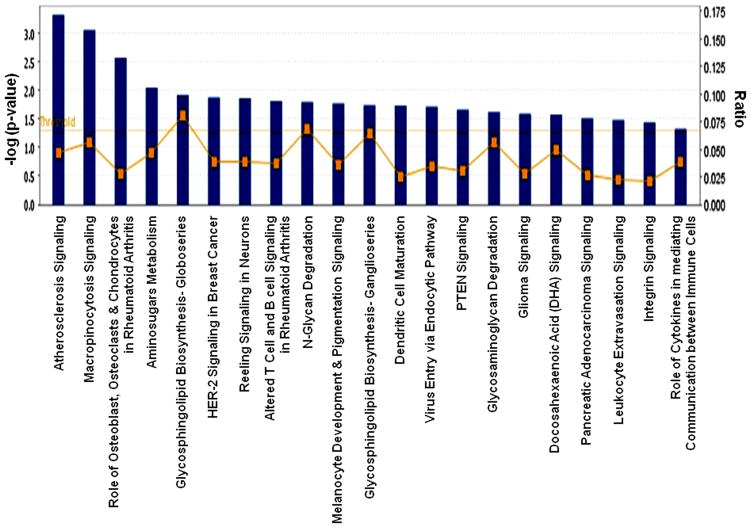
Figure 4.
The significant canonical pathways involved in the well-characterized cell signaling and metabolic pathways associated with the genes that differentially expressed in High PCB exposure. The threshold line in the bar chart represents a p-value of 0.05. The ratio (r) is calculated by the number of genes from the our data set of differentially expressed gene set that participate in a Canonical Pathway, and dividing it by the total number of genes in that Canonical Pathway in IPA analysis.

