
Figure 3.
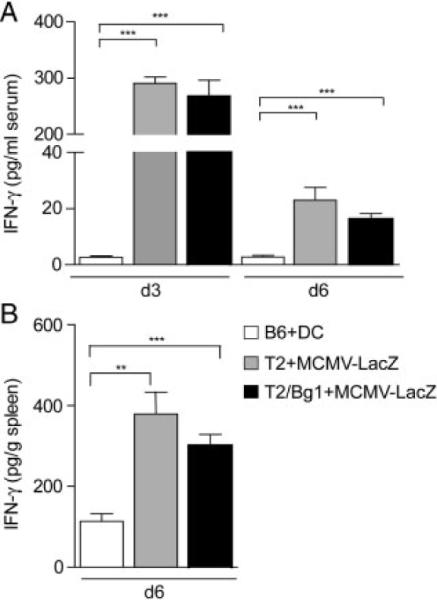
IFNγ-concentration in serum (A) and spleen homogenates (B) of DC-immunized, MCMV-LacZ infected B6, and Bg1 TCR transgenic T-cell-transfused B6 mice. ELISA results are expressed as the mean1 SEM of six mice per group. Statistical analysis was performed using the Student's t-test (**p<0.001; **p<0.01).