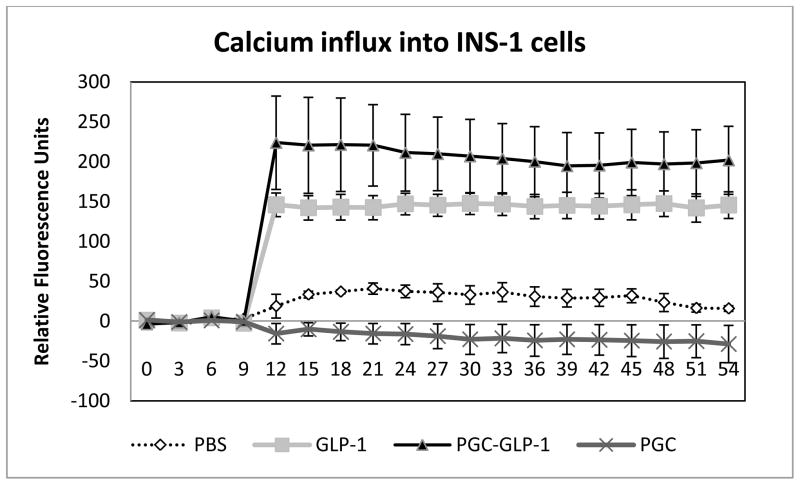
Fig. 5. Calcium influx experiment in INS-1 cells indicates that GLP-1 formulated in PGC-C18 is biologically active.
PBS, GLP-1, GLP-1 in PGC-C18, and PGC-C18 alone were applied to INS-1 cells at the 10 second time point and the increase in fluorescence (mean +/− SEM) resulting from calcium influx into the cells was monitored. In this assay, INS-1 cells were seeded in black 96 well plates at 200,000 cells per well in a buffered medium containing RPMI/10%FBS/11.1mM glucose/10mM HEPES, pH7.4/1mM pyruvate/50uM 2-Mercaptoethanol. Cells were allowed to adhere overnight and were then labeled by replacing the medium with 20ul of 5 ug/ml Fura2AM in PBS pH7.4/2%FBS/11.1mM glucose. Cells were exposed to this Fura2AM solution for two hours followed by the addition of 180 uL PBS solution (pH7.4/2%FBS/11.1mM glucose) to dilute the Fura2AM that was not absorbed into the cell cytoplasm. Fluorescence (340ex/510em) was monitored and after 10 seconds free GLP-1, and GLP-1 formulated in PGC-C18 (n=6 each) were added to a final GLP-1 concentration of 30nM (0.1ug/mL). The PGC-C18 formulated GLP-1 has a PGC-C18:GLP-1 weight ratio of 50:1, similar to that used in the animal efficacy study. For controls, PBS or an equivalent amount of PGC-C18 (n=6 each) was added instead of GLP-1. The influx of calcium into the cells is reflected by the increase of fluorescence, along the y-axis. There was no statistical significant difference in the fluorescence between the PBS and PGC-C18 groups, or between GLP-1 and PGC-C18:GLP-1 groups. When the PBS group was compared to PGC-C18:GLP-1 and GLP-1 alone group for the fluorescence measured after the 12sec time point (2 sec after addition of the compounds), the p-values of t-tests were p<0.01 and <0.001, respectively, indicating that both GLP-1 alone and GLP-1 formulated in PGC-C18 were biologically active.

