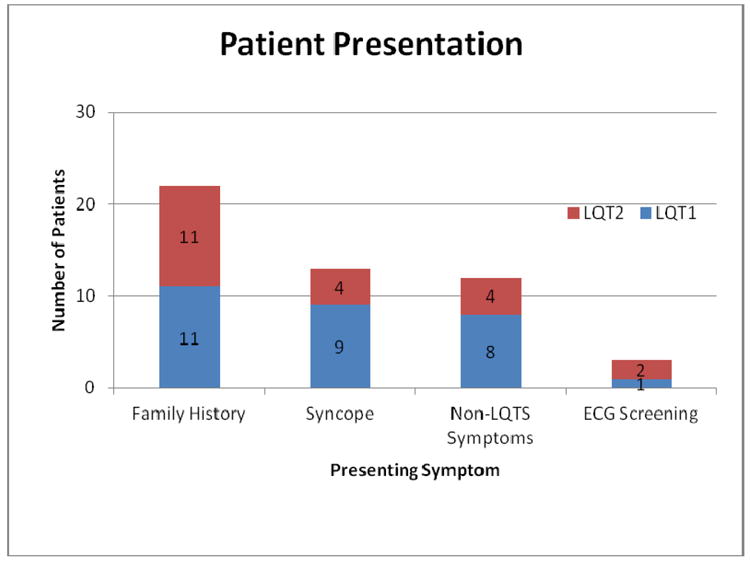
Figure 1.

Clinical Presentation. Bar graph demonstrates patient presenting characteristics in the LQT1 and LQT2 groups. The most common presentation was family history followed by syncope. There was no major difference in the presentation distribution in either LQTS group.
